Turn Algerian banks' financial data into comparative analyses and decisions.
Analyse a bank. Compare it to peers. Track its trajectory. Understand its market position.
ABIX Data Explorer transforms banking financial data into a structured reading of the market: activity, deposits, credit, profitability, efficiency, growth, equity capitalization, balance sheet structure and competitive position.
Immediate access to DEMO mode with fictitious data — no credit card required.
21 banks
Current covered banking catalogue
Multi-year data
History available depending on edition and license
Dozens of KPIs
Source data, ratios and derived indicators
4 financial dimensions
Profitability · Growth · Efficiency · Capitalization
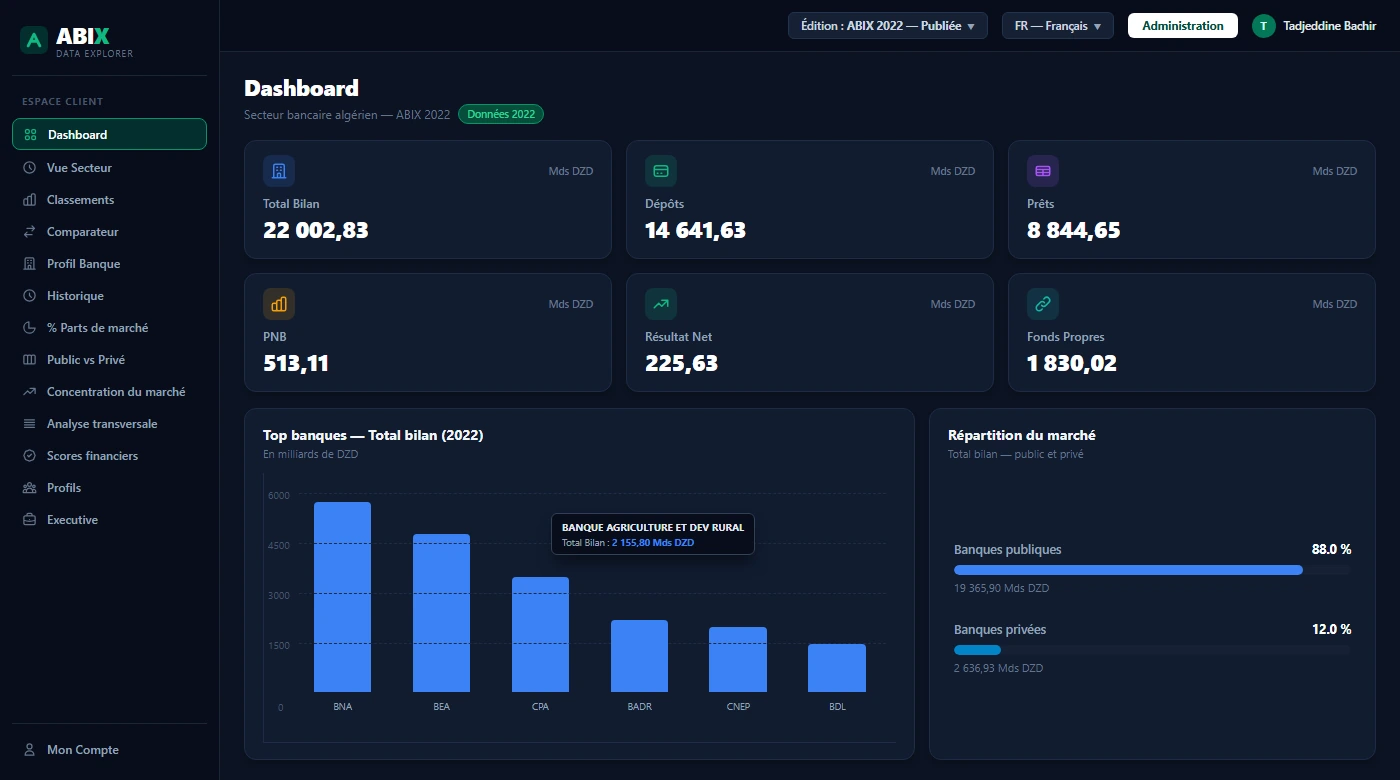
The entire banking sector in a single interface
Switch from a sector view to a single bank analysis in seconds. Explore data, trends, rankings and comparisons without handling multiple Excel files or reports.
Sector view
Financial aggregates, annual evolution, market composition and main players.
Rankings
Banks' position by indicator and by year.
History
Values, annual variations, Base 100 and CAGR.
Comparison
Simultaneous analysis of multiple banks, indicators or dimensions.
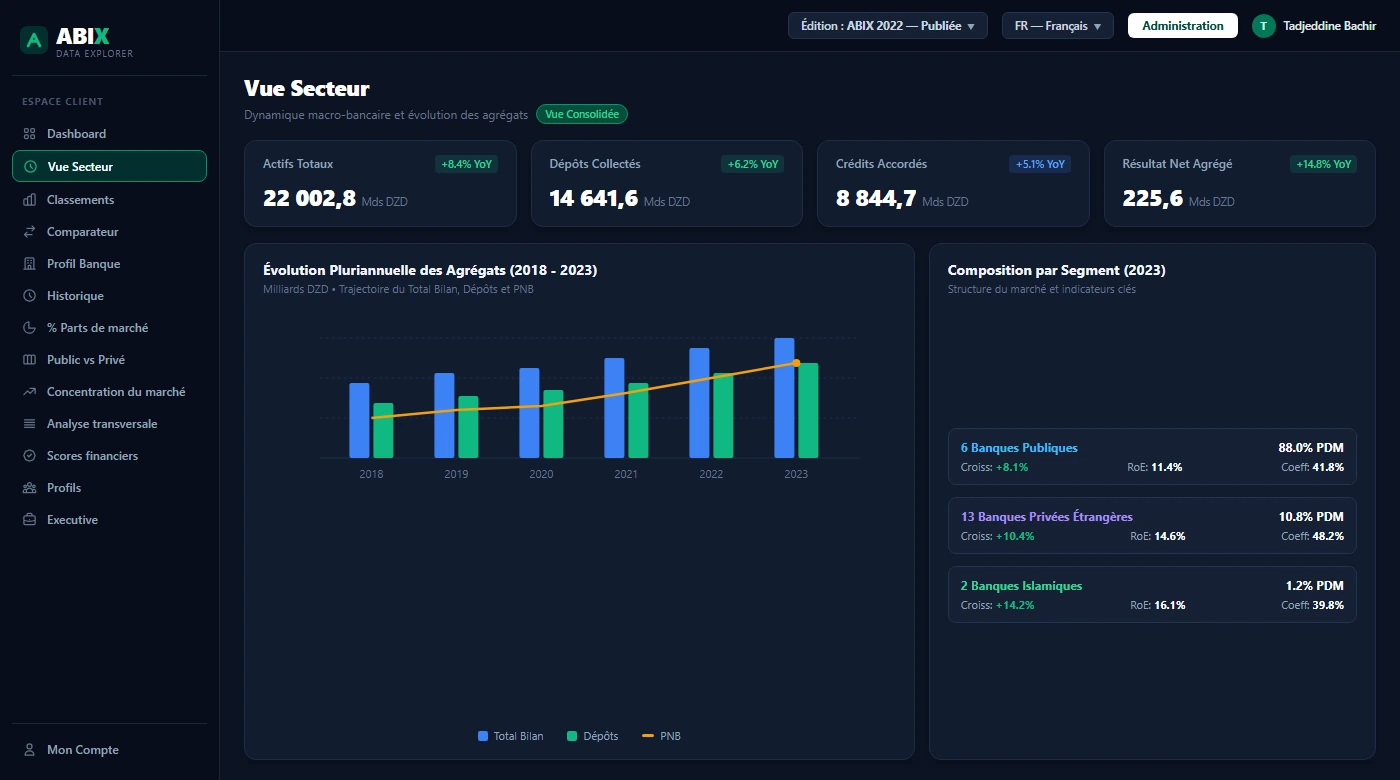
Illustration — fictitious data used for demonstration purposes.
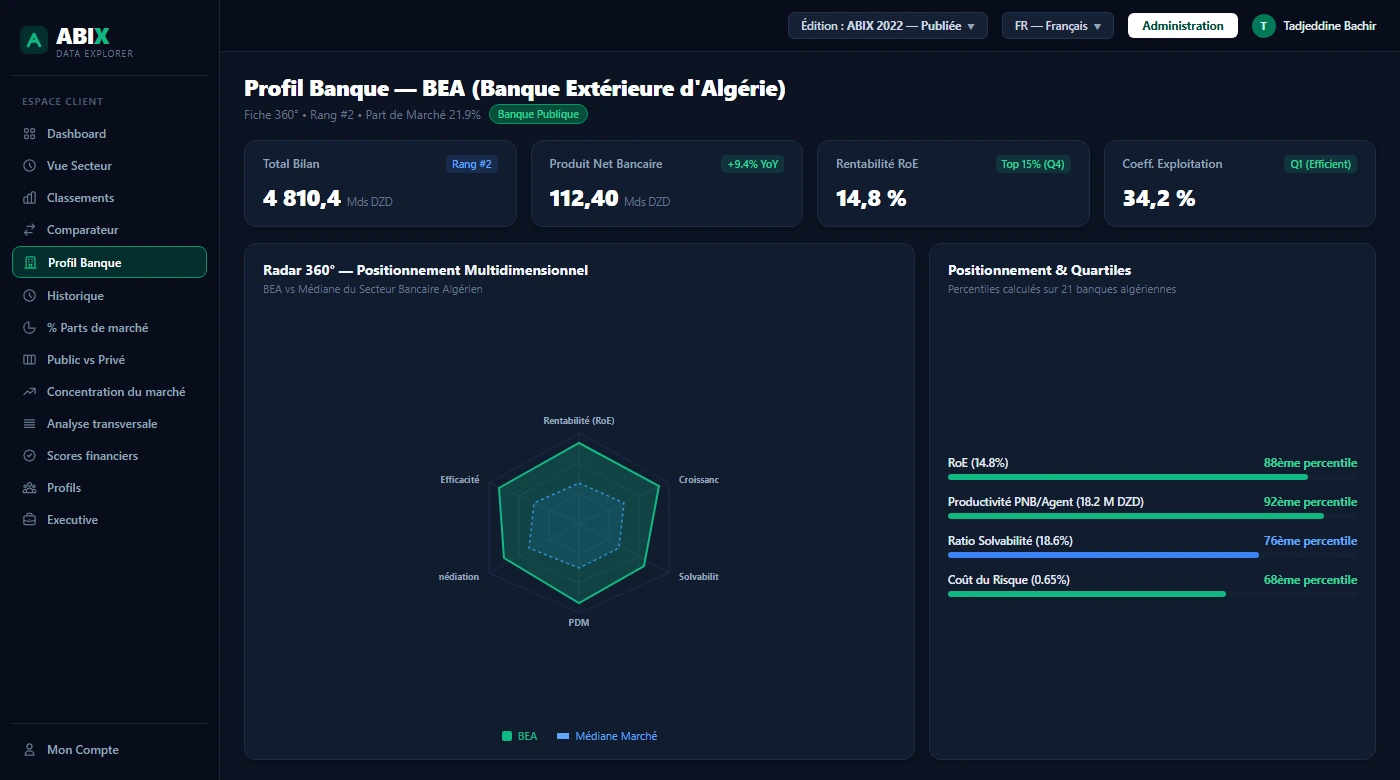
Illustration — fictitious data used for demonstration purposes.
One bank. One view. All essential indicators.
ABIX Data Explorer gathers in a single profile a bank's financial trajectory, competitive positioning, benchmarks and main attention signals.
The profile associates depending on available data: current value, annual evolution, history, CAGR, benchmark, mean and median, percentile, quartile, rank and market share.
Compare a bank to its true environment
A relevant comparison is not just about comparing all banks together. ABIX Data Explorer allows contextualizing results and building more relevant peer groups.
Market
Overall positioning against the entire Algerian banking sector.
Status / Category
Homogeneous comparison between public and private banks.
Size
Grouping by asset volume to compare comparable institutions.
Asset profile
Contextualization according to balance sheet structure and orientation.
Peer group
Custom group creation when data permits.
Performance is only meaningful when put in context.
Who is truly gaining ground?
A bank can show positive growth while losing market share. ABIX distinguishes absolute growth, relative position and contribution to sector dynamics.
- Market share
Calculated on major financial aggregates
- Gain or loss
Share evolution in percentage points
- Contribution
Bank's share in sector growth
- Growth gap
Relative performance compared to market average
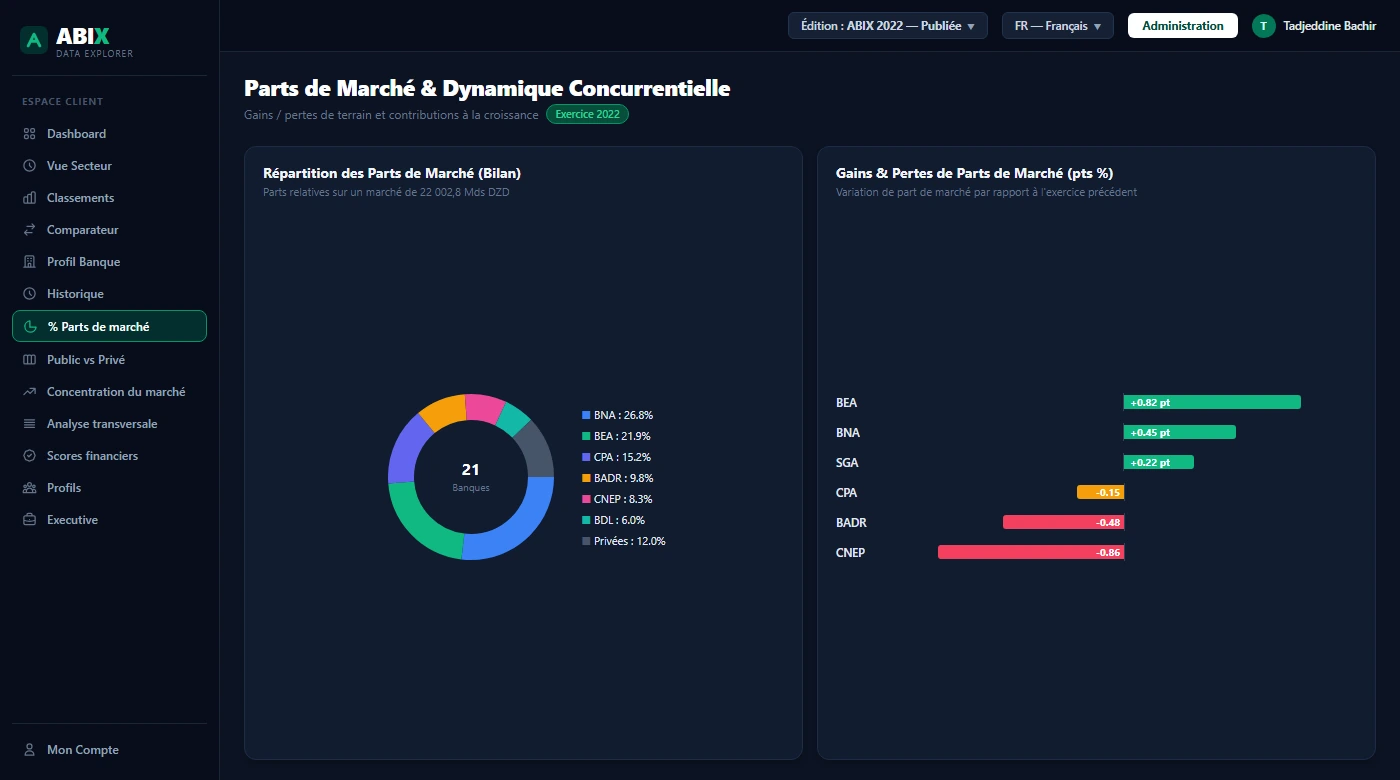
Illustration — fictitious data used for demonstration purposes.
Measure banking market concentration
Track the evolving weight of leaders and the transformation of the competitive market structure.
- CR1, CR3, CR5, CR10
Cumulative weight of the sector's largest players.
- HHI (Herfindahl-Hirschman)
International benchmark concentration index.
- Effective number of banks
Indicator of the actual diversity of market players.
- Cumulative key players
Number of banks needed to reach 50%, 75% or 90% of the market.
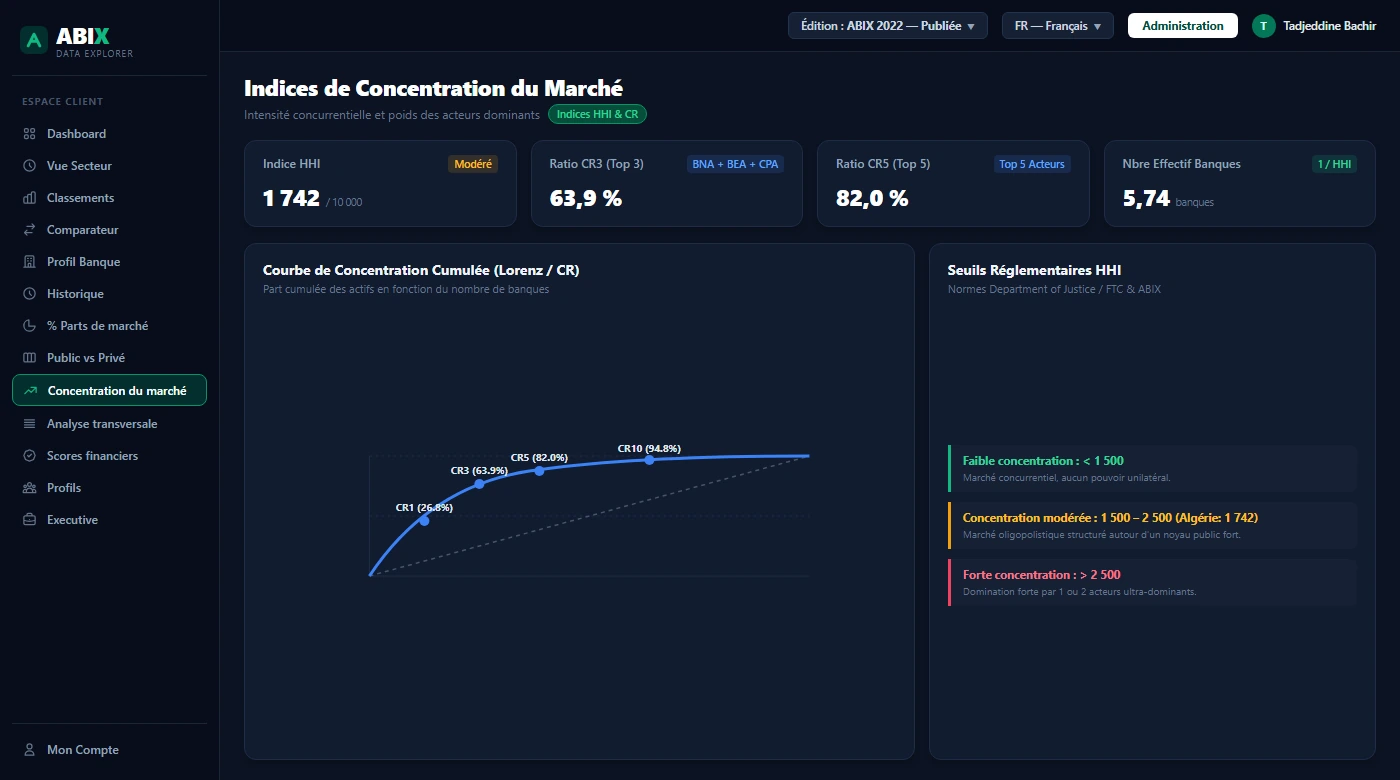
Illustration — fictitious data used for demonstration purposes.
Go beyond tables and rankings
Heatmaps
Quickly identify performance, growth and structure gaps.
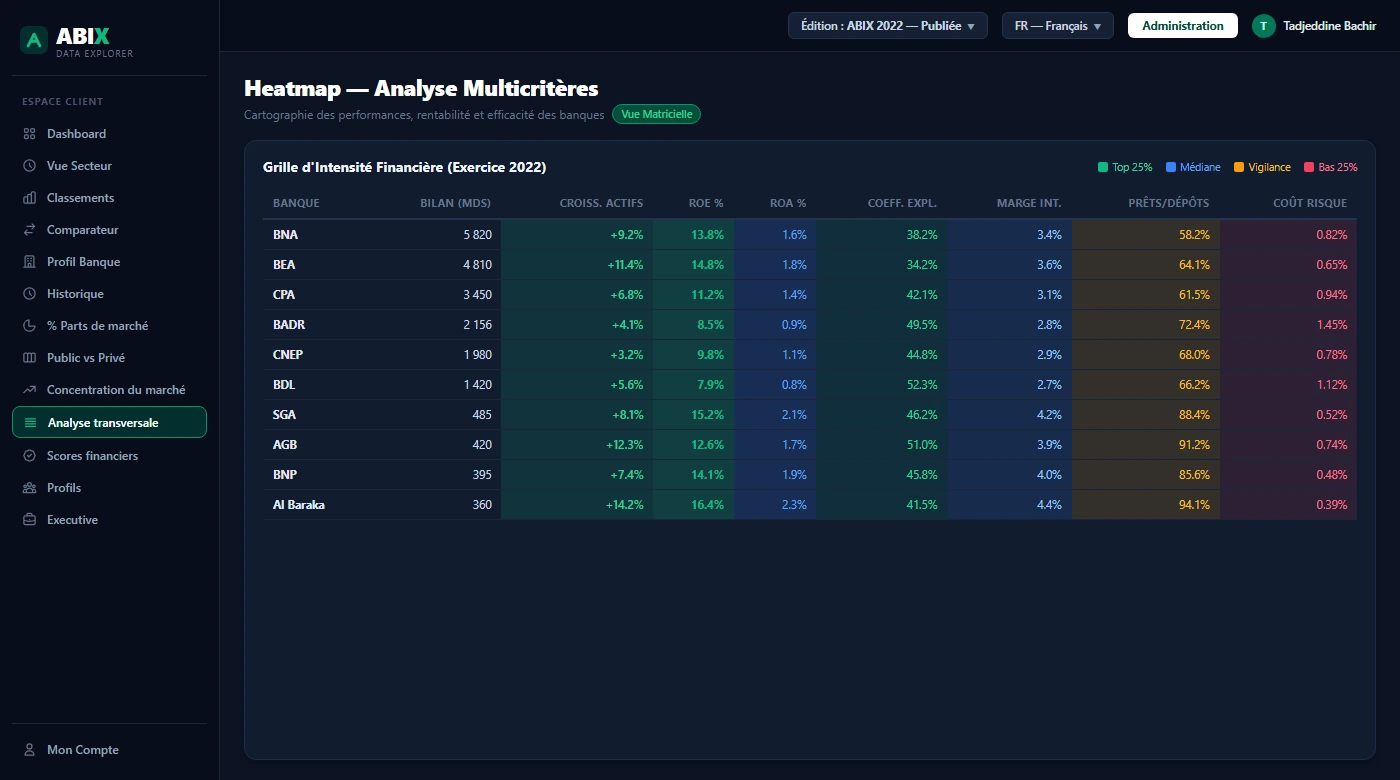
Illustration — fictitious data used for demonstration purposes.
Strategic matrices
Cross key dimensions: Size × Profitability, Growth × Profitability, Intermediation × Profitability, Credit × Treasury, Provisioning × Profitability, NBI Growth × Efficiency.
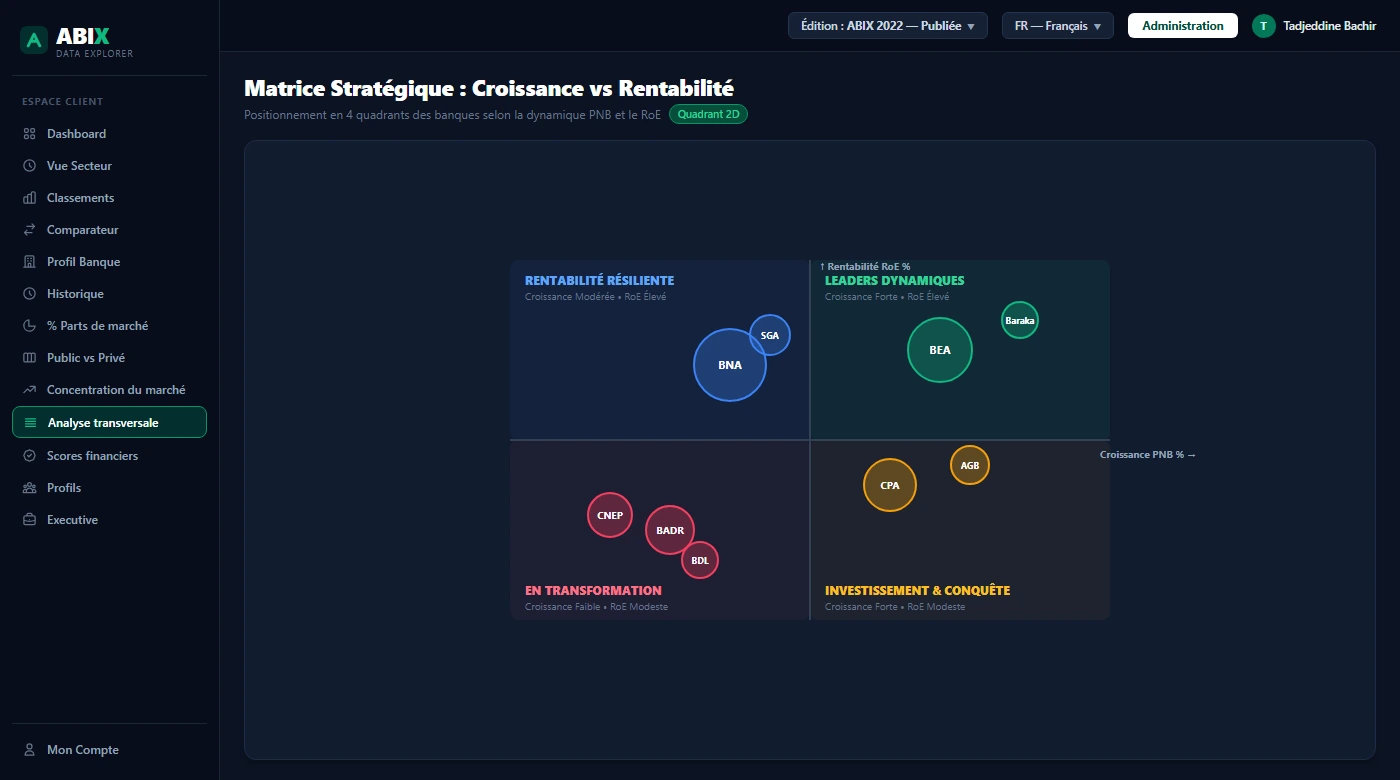
Illustration — fictitious data used for demonstration purposes.
Momentum
Identify accelerations, decelerations and trajectory changes.
Rank history
Observe progressions, declines and stability of a bank's positioning.
Outliers
Detect observations that deserve further investigation.
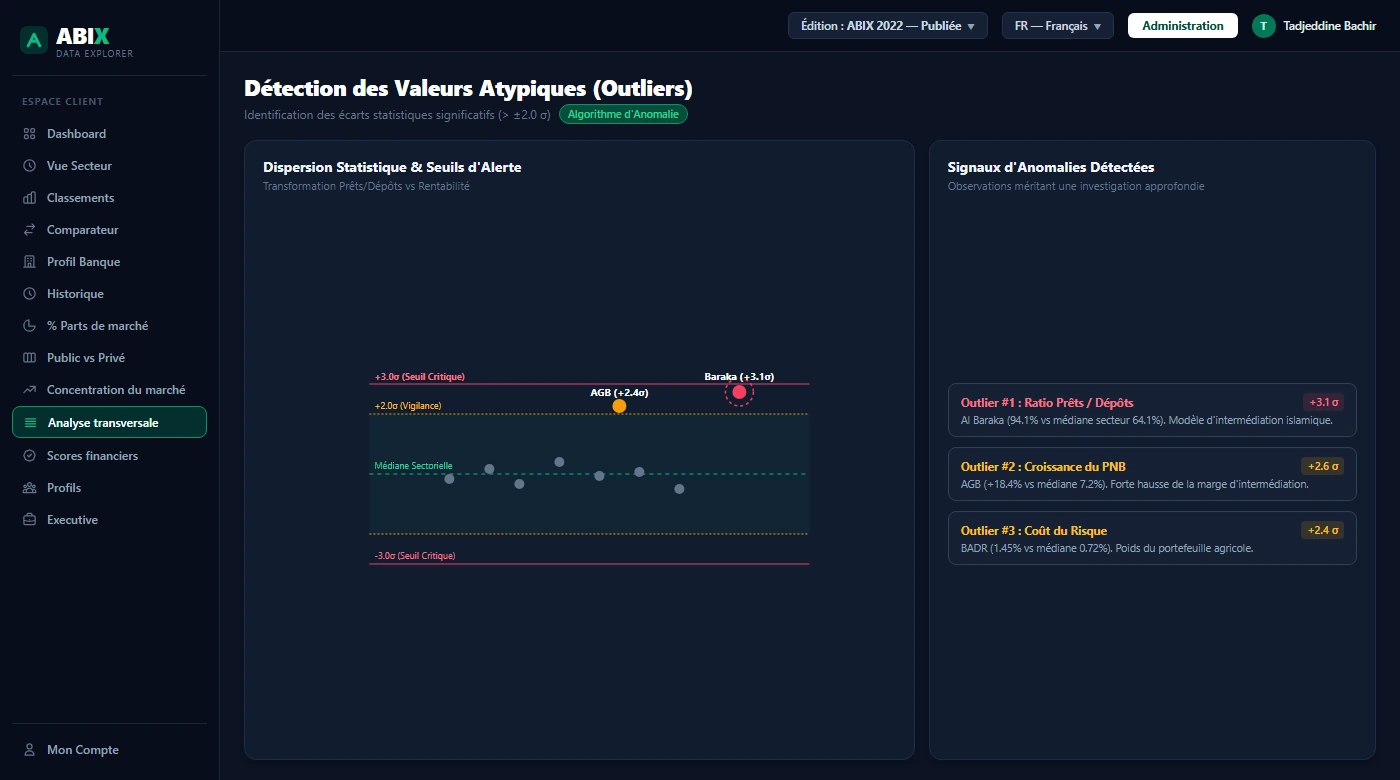
Illustration — fictitious data used for demonstration purposes.
Four dimensions to understand a bank's profile
Profitability
Ability of the bank to turn activity and resources into net results.
Growth
Development dynamics across multiple fiscal years.
Efficiency
Operational control and conversion capacity of operating income.
Accounting Capitalization
Relative position of equity in balance sheet and credit structure.
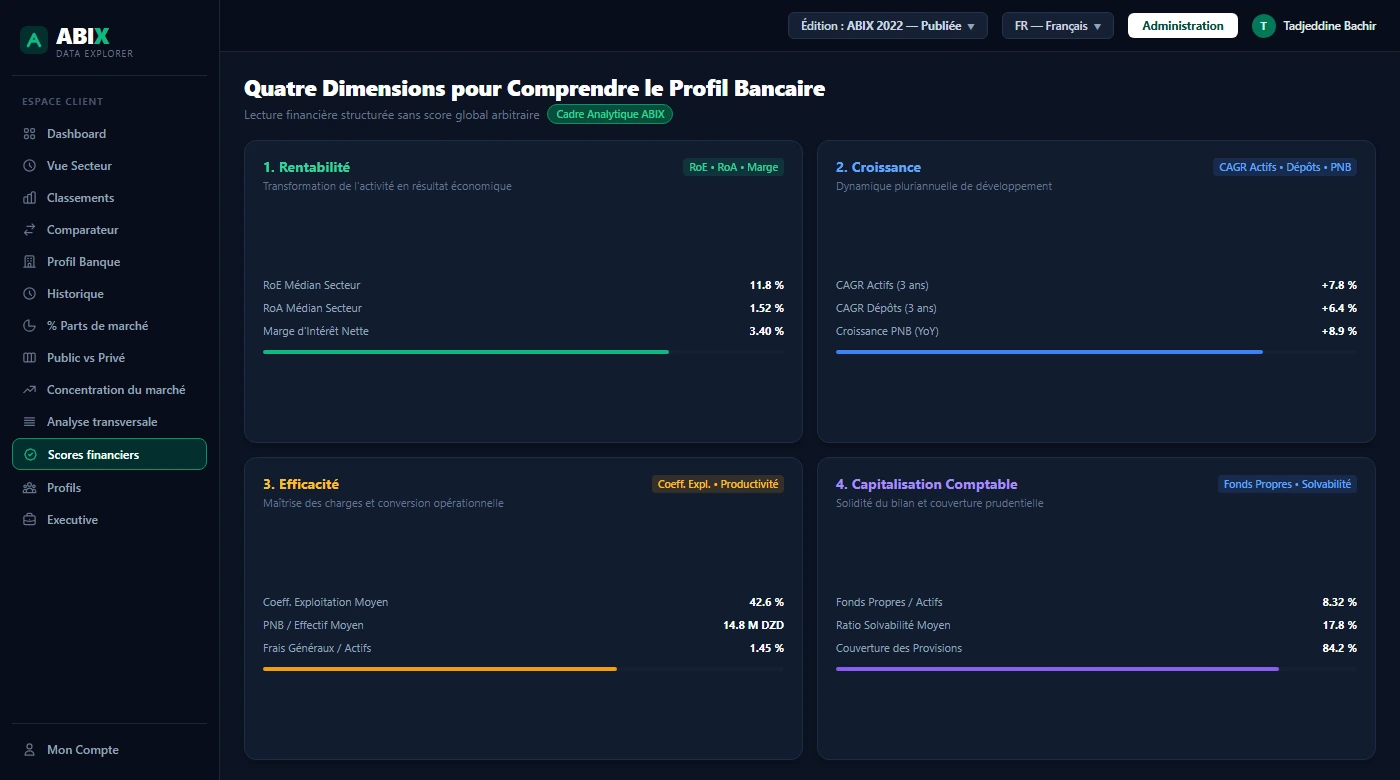
Illustration — fictitious data used for demonstration purposes.
From data to executive message
ABIX Data Explorer automatically highlights evolutions deserving decision-maker attention.
Explainable and traceable findings
Findings rely on deterministic, versioned analytical rules. Each message can be traced back to the data and analysis that triggered it.
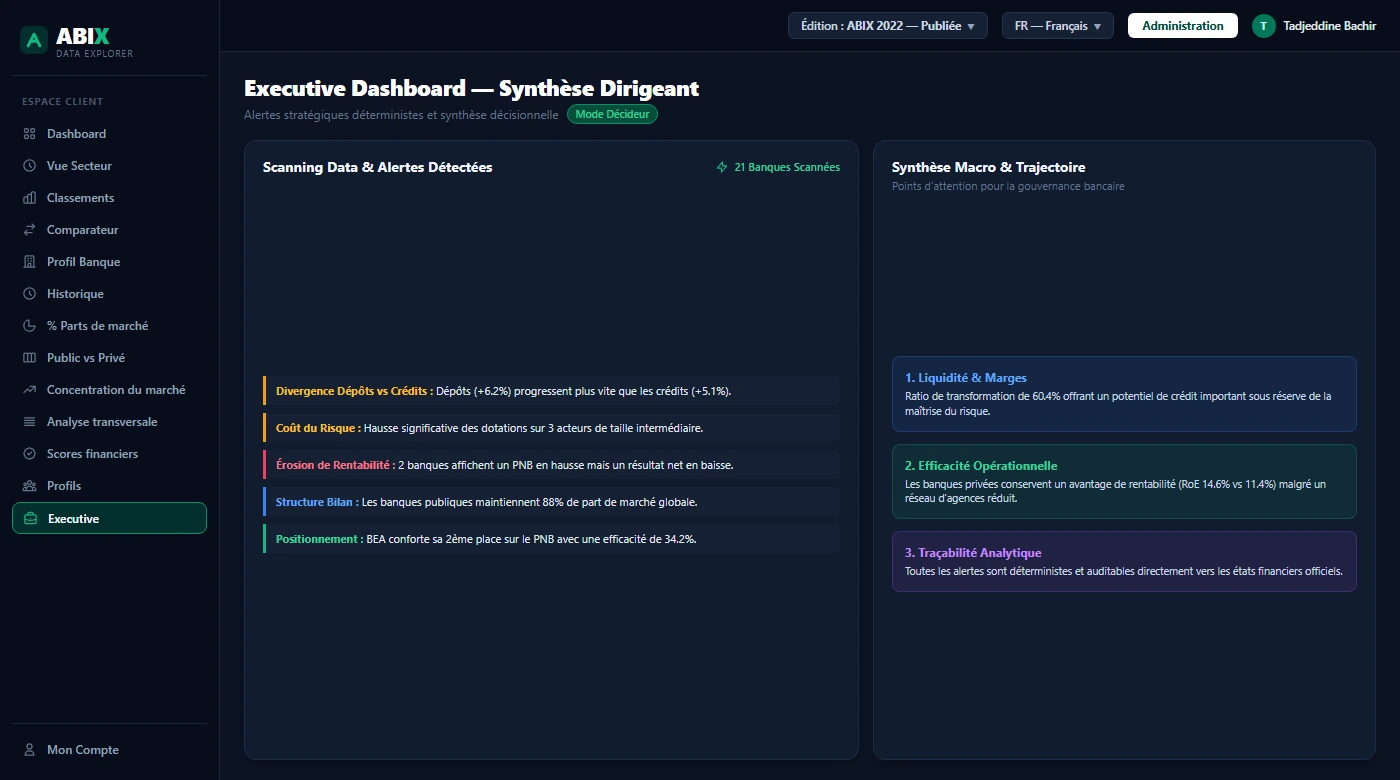
Illustration — fictitious data used for demonstration purposes.
Designed for those who must understand the banking market
General Management
Quickly identify important evolutions and the bank's positioning.
Finance Department
Analyse profitability, efficiency, growth, balance sheet structure and capitalization.
Strategy Department
Track market shares, competitors, trajectories and position changes.
Financial Analysts
Explore data, ratios, histories and comparisons.
Credit & Counterparty
Prepare the financial context of a bank before a fuller prudential and qualitative analysis.
Consulting & Research
Quickly produce structured comparative analyses of the Algerian banking market.
Analyses designed to be verifiable
Discover the methodologyVersioned data
Organized by bank, indicator, year and edition.
Rigorous missing data handling
Absent data remains N/A and is never automatically treated as zero.
Centralized calculations
Ratios, CAGRs, market shares, percentiles and benchmarks rely on homogeneous rules.
Traceability
Results can be linked to their analytical source and parameters.
These dimensions and analyses are provided for comparative and methodological purposes. They must never be interpreted as a credit rating, regulatory rating, official solvency measure or probability of default.
Test ABIX Data Explorer before subscribing
Create your free account and explore the main features of ABIX Data Explorer with real Algerian banks and a fully fictitious dataset.
Explore multiple years
Access DEMO 2022, 2023, 2024 and 2025 editions.
Compare banks
Test rankings, ratios, bank profiles, comparisons and history.
Switch to real data whenever you want
Subscribe to Pro or Corporate to unlock real ABIX financial data.
Free — no credit card required.
Banking data shouldn't just be viewed. It should be explored.
With ABIX Data Explorer, move from raw numbers to comparison, from ranking to trajectory, and from data to market understanding.